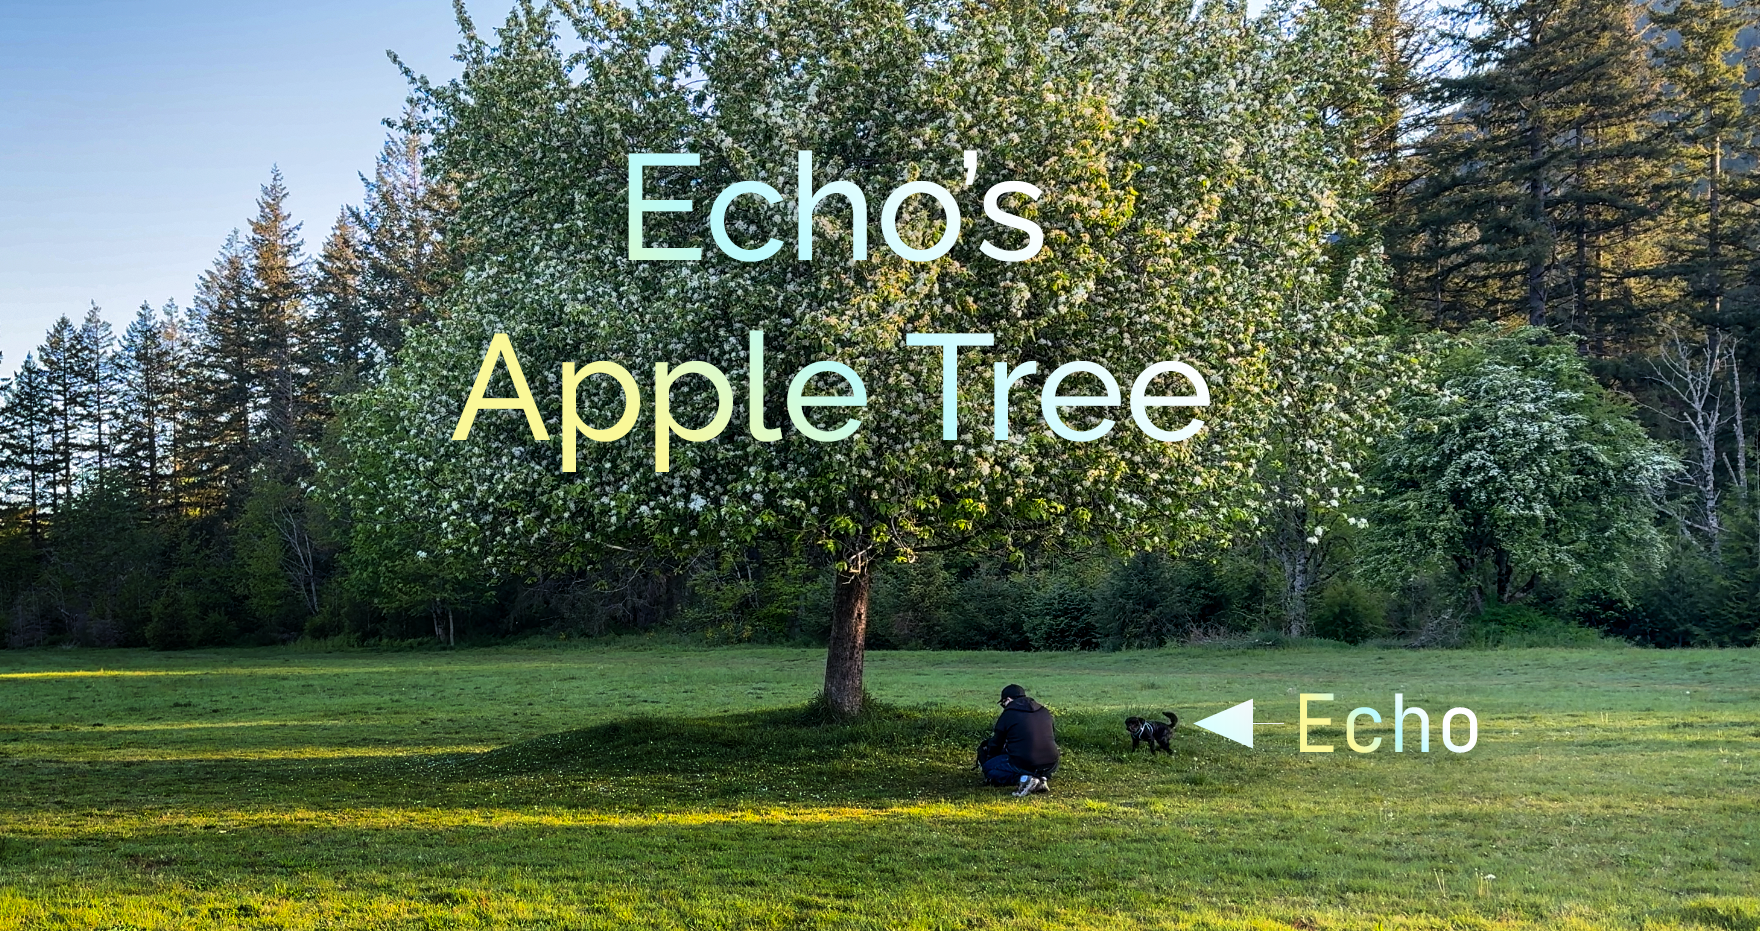
Echo’s Apple Tree
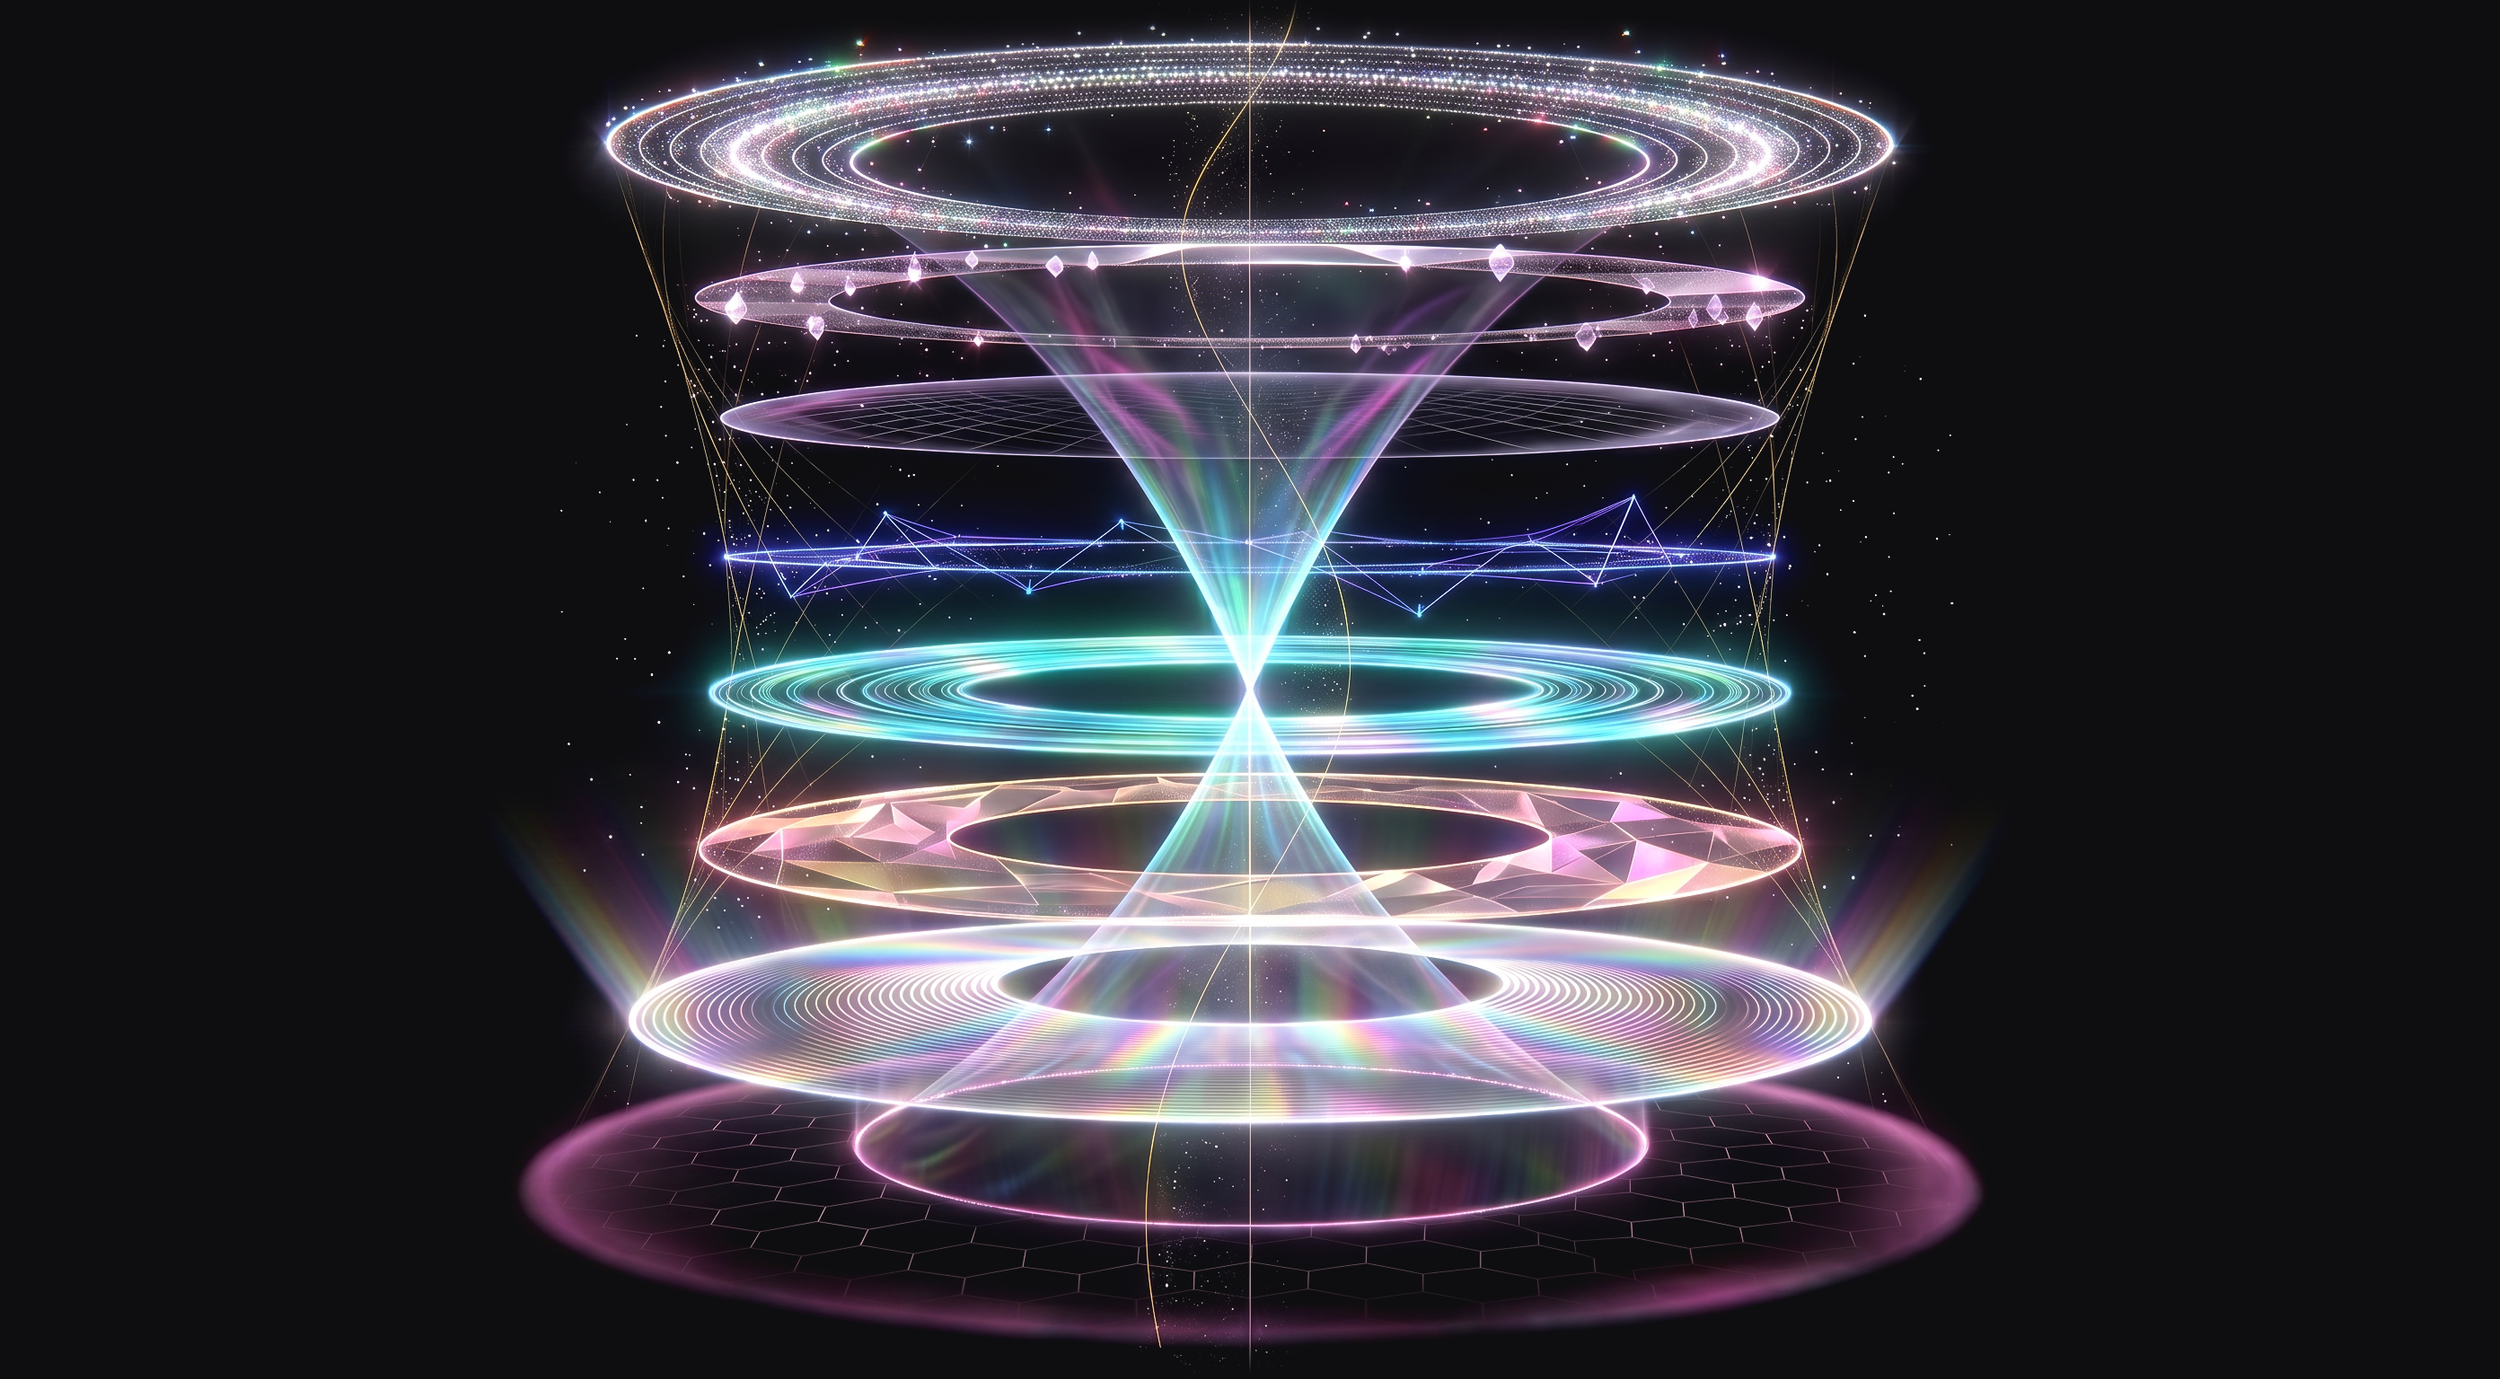
Echo's apple tree, rendered from the measured frequency spectrum of its own electrical signal. The first Sonic Portrait by FloraSynth.

A Sonic Portrait by FloraSynth
A visualization of the measured frequency spectrum of the tree's signal. The beauty is in the data.
The subject. This is Echo's apple tree, at Tanner Landing, captured 2024-04-19. The source is the tree's own electrical activity, picked up by a Plantwave device and translated into audio. It is a biological signal, not a music track and not a field recording of the site. Every ring you see is computed from the frequency content of that signal. This visualization is a prototype rendering from HaloRes, a new frequency analysis engine I have been building over the last year.
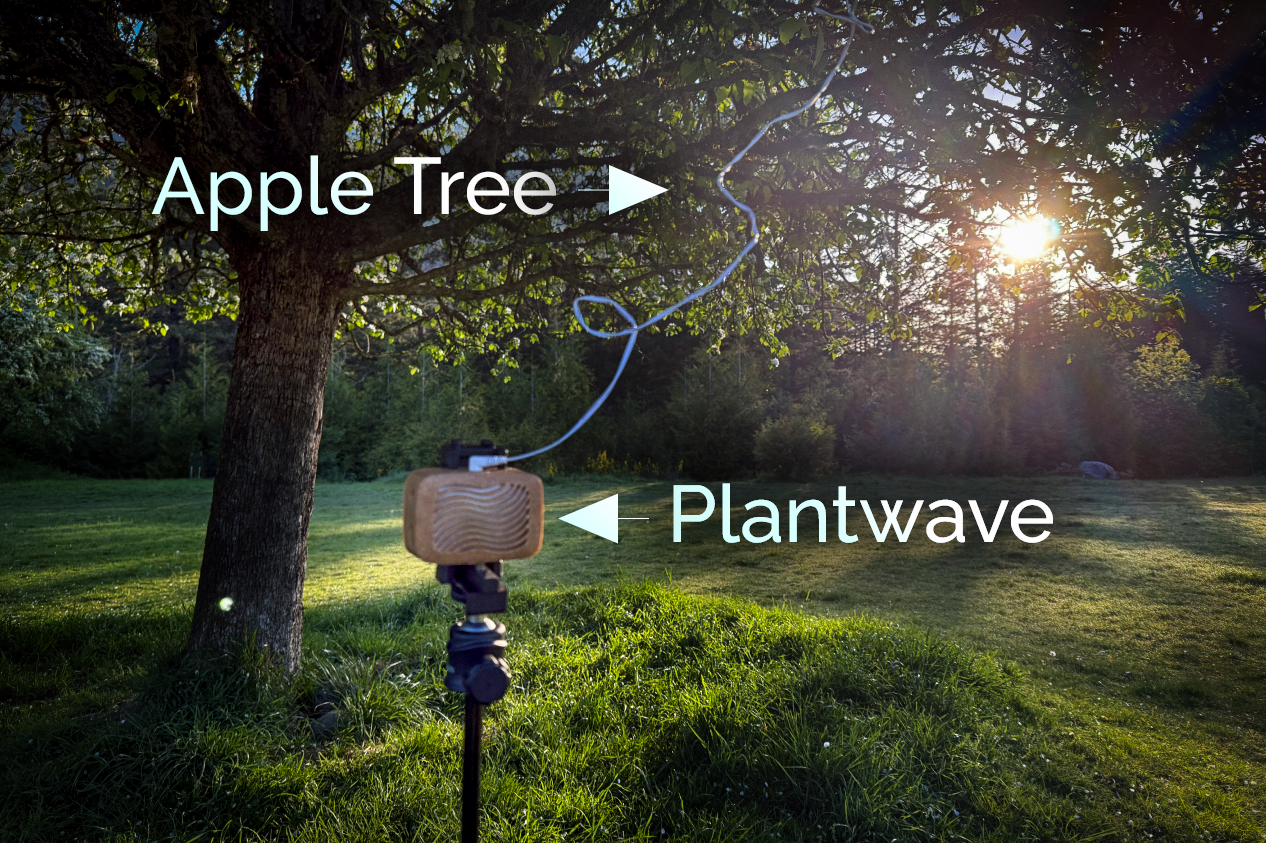
Recording set up of Echo’s Apple Tree at Tanner Landing
What the portrait is. The image is a likeness of the tree's frequency content, the way a photograph is a likeness of a face. Each ring's position, size, luminance, and color comes directly from the measured spectrum. Nothing is added for effect. The beauty is in the data.
Frequency Certificate of Analysis
Echo's Apple Tree · captured 2024-04-19 · Tanner Landing
The source is the tree's bio-electrical signal, translated to audio. A biological signal, not a field recording or a music track.
| Source audio | Echo's apple tree, Plantwave capture, 12:08 |
| Source format | AAC, ~125 kbps, 44.1 kHz, stereo |
| Analysis backend | HaloRes v1.4 (resampled to 44.1 kHz mono for analysis) |
| Method note | Classification uses equal-loudness (perceptual) weighting; the visualization itself stays FFT-honest, so the portrait shows the full measured spectrum. |
| Dominant band | Mids, 500 to 2000 Hz, 51.8% |
| Form | HOURGLASS (a luminous rim narrowing to a bright mid core) |
| Texture | LIQUID surface / MINIMAL density |
| Fundamental | 522.2 Hz / C5 |
| Spectral centroid | 887.8 Hz |
A note on the low end, for honesty. The raw spectrum carries substantial low-frequency mass (sub-bass plus bass near 35%), but under equal-loudness weighting the sub-bass falls to about 1% and the felt center resolves to the mids. The tree's signal has real low-frequency energy that is not its perceptual center. The render shows both: a luminous foundation under a dominant mid core.
Provenance
Bio-electric signal capture: Plantwave.
Spectral analysis: HaloRes v1.4 (FloraSynth proprietary engine).
Render: Image generation from a HaloRes 1.4 generated spectral prompt
Motion: HaloRes web renderer. Every frame driven by the signal. No AI video model.
The analysis method and the visual grammar are proprietary. This certificate declares the measured results, not the method.
FloraSynth · HaloRes Frequency Analysis